Exadata Healthcheck – Top 5 Tools and Features!

Hi all,
It’s not new for Oracle DBAs the countless great tools we have out of the box to help us out with our daily tasks, such as ORAchk/EXAchk/ODAchk, Database Security Assessment Tool (DBSAT), Hang Manager, Cluster Health Advisor (CHA), Cluster Verification Utility (CVU), Memory Guard, Tracefile Analyzer (TFA) with tools like oratop, procwatcher, oswatcher, pstack, RDA, and the list goes on and on…

The good news is, most of the tools are now together on the Autonomous Health Framework (AHF), since version 12.2. None of those tools are running by default though, so you might need to choose some to start and enable on your environment.

But out of all this list, what if we could choose the top 5 features we can and should use as a start for Exadata Environment? Well, I did mine, see it below.

Oh, and by the way, you don’t pay anything else for them, counting you already have Oracle Support Services!

1. Cluster Health Advisor – Calibrate your Exa Environment!

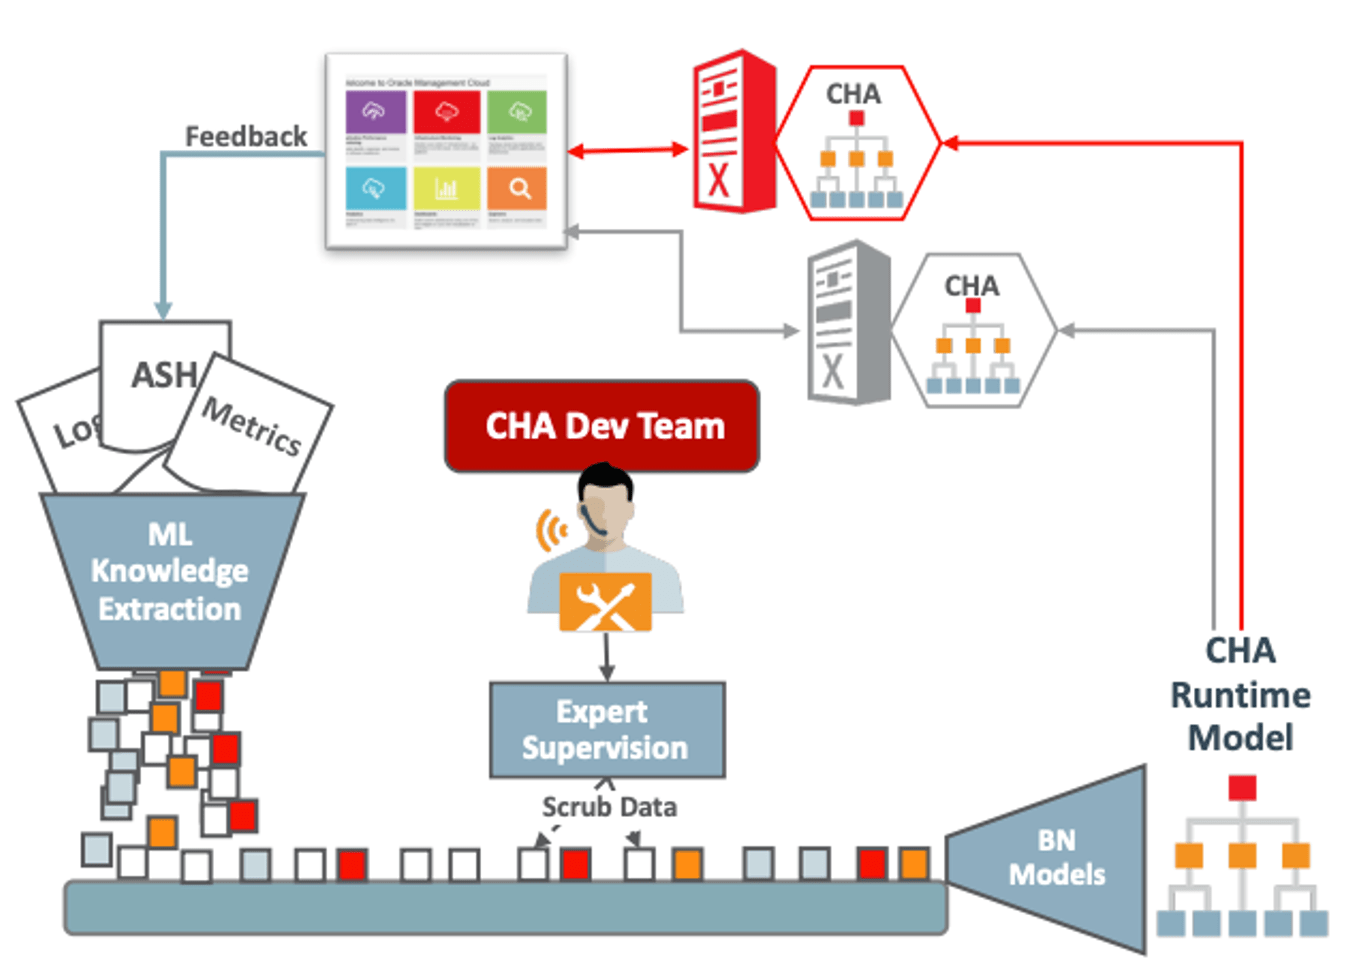
Available along with the AFH since 12.2, the CHA works along the Cluster Health Monitor to provide you fine-grained notifications and correlations about your environment. And when I say it, I mean it: YOUR environment. This is because the CHA works better if you calibrate it with your statistics. As usual, not the worse problematic day or the low workload night, but an average day which can be used as a reference. All this is stored in the GIMR (as shown below) and used for future comparison and model inference.

This means the CHA is not a long list of IFs with fixed metrics, but an intelligent tool monitoring over 127 processes that perform work based on your workload. Not only this, the CHA is enriched with Machine Learning algorithms that model over 30 known DB problems based on over 150 metric predictors.


An example of inference can be seen below, where network and Global Cache statistics are used to inference a network issue.

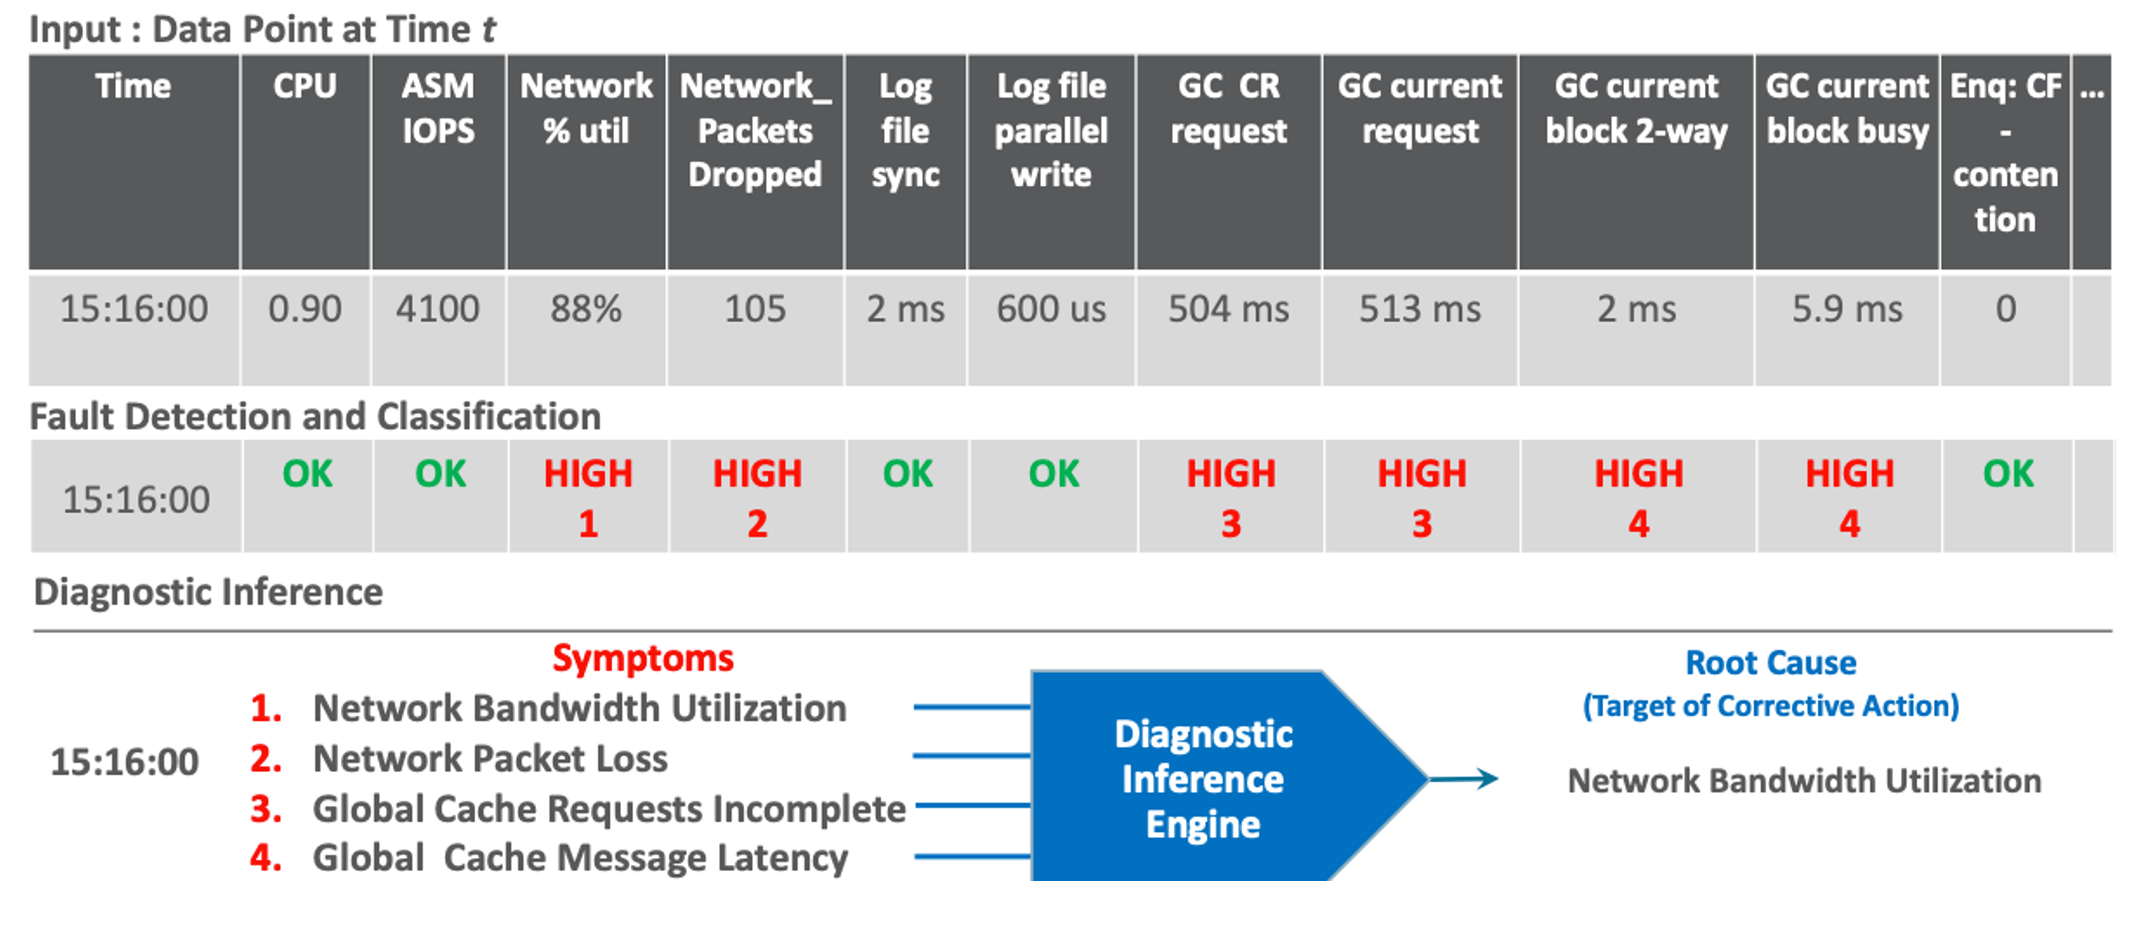
Not rocket science, but always nice to have someone digesting tons of logs and metrics and reaching this sort of conclusion unassisted, right? You as DBA can steal all credits for the finding, no hard feelings.

And this is just one of the things CHA provides. It has tons of other functionalities. You should try using it more!


2. EXAchk – Daily Automated Runs (and Reports)

Most likely if you have an Exadata, you are used to running from time to time an EXAchk to review the recommendations and best practices for your environment. It’s something that requires almost no effort to run and to copy the reports, or you most likely have created an script to do so. What if I tell you Oracle has now automated this with AHF?

All you need to do is to confirm the scheduled runs and set the address for the reports to be sent. Find below a quick Cheatsheet:

a. Checking Status of the EXAchk

[root@exa01dbadm01 ~]# exachk -d info
------------------------------------------------------------

Master node = exa01dbadm01

exachk daemon version = 211300

Install location = /opt/oracle.ahf/exachk

Started at = Wed Jun 16 11:58:03 MDT 2021

Scheduler type = TFA Scheduler


[root@exa01dbadm01 ~]# exachk -d status
exachk is using TFA Scheduler. TFA PID: 369350

b. Checking Status of TFA Daemon Status and Auto Start

[root@exa01dbadm01 ~]# ahfctl statusahf

.-----------------------------------------------------------------------------------------------------.
| Host | Status of TFA | PID | Port | Version | Build ID | Inventory Status |
+--------------+---------------+--------+------+------------+----------------------+------------------+
| exa01dbadm01 | RUNNING | 369350 | 5000 | 21.1.3.0.0 | 21130020210607124914 | COMPLETE |
| exa01dbadm02 | RUNNING | 118950 | 5000 | 21.1.3.0.0 | 21130020210607124914 | COMPLETE |
'--------------+---------------+--------+------+------------+----------------------+------------------'

------------------------------------------------------------

Master node = exa01dbadm01

exachk daemon version = 211300

Install location = /opt/oracle.ahf/exachk

Started at = Wed Jun 16 11:58:03 MDT 2021

Scheduler type = TFA Scheduler

------------------------------------------------------------
ID: exachk.autostart_client_exatier1
------------------------------------------------------------
AUTORUN_FLAGS = -usediscovery -profile exatier1 -syslog -dball -showpass -tag autostart_client_exatier1 -readenvconfig
COLLECTION_RETENTION = 7
AUTORUN_SCHEDULE = 3 2 * * 1,2,3,4,5,6
------------------------------------------------------------
------------------------------------------------------------
ID: exachk.autostart_client
------------------------------------------------------------
AUTORUN_FLAGS = -usediscovery -syslog -tag autostart_client -readenvconfig
COLLECTION_RETENTION = 14
AUTORUN_SCHEDULE = 3 3 * * 0
------------------------------------------------------------

Next auto run starts on Jun 17, 2021 02:03:00

ID:exachk.AUTOSTART_CLIENT_EXATIER1

c. Gather EXAchk Next Automated Run

[root@exa01dbadm01 ~]# exachk -d nextautorun

Next auto run starts on Jun 17, 2021 02:03:00

ID:exachk.AUTOSTART_CLIENT_EXATIER1

[root@exa01dbadm01 ~]#

d. Changing EXAchk Notifications:

[root@exa01dbadm01 ~]# exachk -get NOTIFICATION_EMAIL,AUTORUN_SCHEDULE,COLLECTION_RETENTION
------------------------------------------------------------
ID: exachk.autostart_client_exatier1
------------------------------------------------------------
COLLECTION_RETENTION = 7
AUTORUN_SCHEDULE = 3 2 * * 1,2,3,4,5,6
------------------------------------------------------------
------------------------------------------------------------
ID: exachk.autostart_client
------------------------------------------------------------
COLLECTION_RETENTION = 14
AUTORUN_SCHEDULE = 3 3 * * 0
------------------------------------------------------------


[root@exa01dbadm01 ~]# exachk -id autostart_client -set NOTIFICATION_EMAIL=boesing@pythian.com

Updated attribute ['NOTIFICATION_EMAIL=boesing@pythian.com'] for Id[exachk.AUTOSTART_CLIENT]

Successfully copied Daemon Store to Remote Nodes


[root@exa01dbadm01 ~]# exachk -get NOTIFICATION_EMAIL,AUTORUN_SCHEDULE,COLLECTION_RETENTION
------------------------------------------------------------
ID: exachk.autostart_client_exatier1
------------------------------------------------------------
COLLECTION_RETENTION = 7
AUTORUN_SCHEDULE = 3 2 * * 1,2,3,4,5,6
------------------------------------------------------------
------------------------------------------------------------
ID: exachk.autostart_client
------------------------------------------------------------
NOTIFICATION_EMAIL = boesing@pythian.com
COLLECTION_RETENTION = 14
AUTORUN_SCHEDULE = 3 3 * * 0
------------------------------------------------------------

[root@exa01dbadm01 ~]# exachk -id autostart_client_exatier1 -set NOTIFICATION_EMAIL=boesing@pythian.com
Updated attribute ['NOTIFICATION_EMAIL=boesing@pythian.com'] for Id[exachk.AUTOSTART_CLIENT_EXATIER1]

Successfully copied Daemon Store to Remote Nodes


[root@exa01dbadm01 ~]# exachk -get NOTIFICATION_EMAIL,AUTORUN_SCHEDULE,COLLECTION_RETENTION
------------------------------------------------------------
ID: exachk.autostart_client_exatier1
------------------------------------------------------------
NOTIFICATION_EMAIL = boesing@pythian.com
COLLECTION_RETENTION = 7
AUTORUN_SCHEDULE = 3 2 * * 1,2,3,4,5,6
------------------------------------------------------------
------------------------------------------------------------
ID: exachk.autostart_client
------------------------------------------------------------
NOTIFICATION_EMAIL = boesing@pythian.com
COLLECTION_RETENTION = 14
AUTORUN_SCHEDULE = 3 3 * * 0
------------------------------------------------------------

e. Change EXAchk Schedule and Retention

[root@exa01dbadm01 ~]# exachk -id autostart_client_exaier1 –set "AUTORUN_SCHEDULE=0 3 * * *" -> Time= 3 AM daily
[root@exa01dbadm01 ~]# exachk-id autostart_client –set "collection_retention=90"

f. EXAchk: Testing Email Sending and Running EXAchk Report over email

This is for ad-hoc testing to check about email sending, out of the scheduled runs.

[root@exa01dbadm01 ~]# exachk -testemail notification_email=boesing@pythian.com
Email Successfully sent to ['boesing@pythian.com'] from 'root@exa01dbadm01
[root@exa01dbadm01 ~]# exachk -sendemail notification_email=boesing@pythian.com


Searching for running databases . . . . .

. . . . . . . . . . . .
List of running databases registered in OCR

1. xxxxxx
2. yyyy
3. None of above

Select databases from list for checking best practices. For multiple databases, select 3 for All or comma separated number like 1,2 etc [1-3][3].
[...]
Detailed report (html) - /u01/app/oracle/oracle.ahf/data/exa01dbadm01/exachk/user_root/output/exachk_exa01dbadm01_xxxxx_061621_134748/exachk_exa01dbadm01_xxxxx_061621_134748.html

UPLOAD [if required] - /u01/app/oracle/oracle.ahf/data/exa01dbadm01/exachk/user_root/output/exachk_exa01dbadm01_xxxxxx_061621_134748.zip
Email Successfully sent to ('boesing@pythian.com',) from 'root@exa01dbadm01' with attachment

3. TFA – Sanitize and Mask Options

Even with all the concerns on sensitive data being more and more relevant, this is something that actually surprised me. It’s possible to Sanitize and Mask data in collections. For example, mask will hide your inner data (let’s say table names):

[root@exa01dbadm01 ~]# tfactl diagcollect -srdc ORA-00600 -mask

Sanitize will hide your hardware setting. Not that useful if you have an Exadata, but might be interesting if you have commodity hardware you don’t want Oracle to know about.

[root@exa01dbadm01 ~]# tfactl diagcollect -srdc ORA-00600 -sanitize

4. TFA Changes – “Nothing was Changed” Resolver Tool

This is for all the DBAs which had already this dialogue:

Client: Yesterday was running fine, and today it’s veeeery slow. Nothing was changed!
DBA: Something changed, that’s for sure.
Client: Absolutely nothing changed.

So now we can access if indeed nothing changed from the client’s perspective (perhaps an automatic statistics gathering or something) or if anybody did something and is hard to identify.

It takes parameters from OS and DB and tracks of old and new values, reporting changes:

[root@exa01dbadm01 ~]# tfactl changes

Output from host : exa01dbadm02
------------------------------
No Changes Found

Output from host : exa01dbadm01
------------------------------
[Nov/14/2021 00:08:33.000]: [db.dbprod19.dbprod191]: Parameter: log_archive_dest_2: Value: service=dbprod19stb => ASYNC NOAFFIRM delay=240 optional compression=disable max_failure=0 reopen=300 db_unique_name=dbprod19stb net_timeout=300
[Nov/14/2021 00:08:33.000]: [db.dbprod19.dbprod191]: Parameter: log_archive_dest_2: Value: service=dbprod19stb => valid_for=(online_logfile,all_roles)

5. Oracle Health Check Collections Manager

Not a surprise if you don’t know this tool, but I’d really recommend you do look for it now. It’s a great tool and as with everything in this post, it’s free!

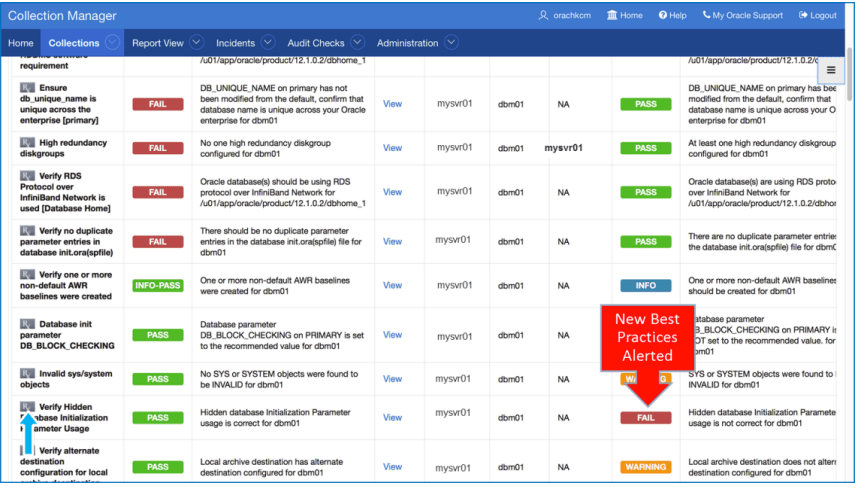
Oracle Health Check Collections Manager is an APEX companion application to Oracle EXAchk that gives you an enterprise-wide view of your health check collection data. All you need to have is an APEX 4.2 or 5 version and deploy the tool. The main idea is that you can consolidate all your reports in one place and, as a plus, you can manage all your EXAchk reports across the time, including a view on the items regression you may have.

This is an example of the view of the collections:

And this is an example of a new best practices failure:

Do you agree with my top list? Let me know your thoughts!

How to send Telegram messages from SQL Server

Hi folks,
You usually receive notifications from SQLServer at your e-mail, right? A nice way to receive updates from your SQL Server Schedule job, it’s sending them through telegram. To do so, you’ll have to configure one additional step and choose Operating System (CmdExec) as a type of command. And to call the Telegram API, we can use a PowerShell command like the following:

powershell "Invoke-RestMethod -Uri 'https://api.telegram.org/bot{API-KEY}/sendMessage?chat_id={CHAT-ID}&text={TEXT}'"

Just replace the following keys with the proper value (don’t forget to remove the curly brackets too).

API-KEY: Your bot API key
CHAT-ID: The ID of the chat where you’ll receive the message, could be a single user, or a chat group
TEXT: Your beloved message.

What else do you use to achieve this kind of alers? Slack? healthchecks.io? Tell us 😉

I bet you heard about ORACLE_PDB_SID, right? But do you know how it works?

This one is more on a curious side =) but somehow interesting.

Not too long ago Mike Dietrichde published a post on to connect directly to a PDB without a password.

After it, lots of DBAs started to post their testing showing the same, But how it works? As there is only a bequeath connection available to a CDB?

Well, I was doing some digging for another project and stumbled on a curious thing. A logon trigger called DBMS_SET_PDB

To my surprise, this trigger alters the session´s container to the one specified by the ORACLE_PDB_SID variable. Similar to Tanel Poder´s script called cc.sql or ccr.sql which basically are short cuts to avoid a lot of typing =)

SYS@CDB19c>select
DBMS_Metadata.Get_DDL('TRIGGER',t.trigger_name,t.owner)
From
DBA_Triggers t
Where
TRIGGER_NAME ='DBMS_SET_PDB'; 2 3 4 5 6

DBMS_METADATA.GET_DDL('TRIGGER',T.TRIGGER_NAME,T.OWNER)
--------------------------------------------------------------------------------

CREATE OR REPLACE NONEDITIONABLE TRIGGER "SYS"."DBMS_SET_PDB" after logon on database
WHEN (user = 'SYS' or user = 'SYSTEM') declare
pdb_name varchar2(64);
begin
DBMS_SYSTEM.get_env ('ORACLE_PDB_SID', pdb_name);
if(pdb_name is not null)
then
EXECUTE IMMEDIATE 'alter session set container = ' || '"' || pdb_name
|| '"';
end if;
exception
when others then
NULL;
end dbms_set_pdb;
ALTER TRIGGER "SYS"."DBMS_SET_PDB" ENABLE

Also is mentioned in the article that this is this would only work on versions 18.8 and above. But well, as we have the code for the trigger, should it possible to work on 12c as well?

Let´s try it| =) the oldest container which I have at the moment is 12r2  but that should do it.

Connected to:
Oracle Database 12c Enterprise Edition Release 12.2.0.1.0 - 64bit Production

SYS@CDB12CR2>select * from v$version;

BANNER CON_ID
-------------------------------------------------------------------------------- ----------
Oracle Database 12c Enterprise Edition Release 12.2.0.1.0 - 64bit Production 0
PL/SQL Release 12.2.0.1.0 - Production 0
CORE 12.2.0.1.0 Production 0
TNS for Linux: Version 12.2.0.1.0 - Production 0
NLSRTL Version 12.2.0.1.0 - Production 0

SYS@CDB12CR2>CREATE OR REPLACE NONEDITIONABLE TRIGGER "SYS"."DBMS_SET_PDB_EFA" after logon on database
2 WHEN (user = 'SYS' or user = 'SYSTEM') declare
3 pdb_name varchar2(64);
begin
4 5 DBMS_SYSTEM.get_env ('ORACLE_PDB_SID', pdb_name);
6 if(pdb_name is not null)
7 then
8 EXECUTE IMMEDIATE 'alter session set container = ' || '"' || pdb_name
9 || '"';
10 end if;
exception
when others then
NULL;
end DBMS_SET_PDB_EFA; 11 12 13 14
15 /

Trigger created.

SYS@CDB12CR2>ALTER TRIGGER "SYS"."DBMS_SET_PDB_EFA" ENABLE
2 /

Trigger altered.

SYS@CDB12CR2>show pdbs

CON_ID CON_NAME OPEN MODE RESTRICTED
---------- ------------------------------ ---------- ----------
2 PDB$SEED READ ONLY NO
3 PDB12CR2 READ WRITE NO
SYS@CDB12CR2>exit
Disconnected from Oracle Database 12c Enterprise Edition Release 12.2.0.1.0 - 64bit Production
[oracle@server01 ~]$ export ORACLE_PDB_SID=PDB12CR2;
[oracle@server01 ~]$ CDB12CR2
The Oracle base remains unchanged with value /oraadm/oracle
LD_LIBRARY_PATH=/oraadm/oracle/product/12.2.0.1/lib
ORACLE_BASE=/oraadm/oracle
ORACLE_HOME=/oraadm/oracle/product/12.2.0.1
ORACLE_PDB_SID=PDB12CR2
ORACLE_SID=CDB12CR2
ORAENV_ASK=NO

[oracle@server01 ~]$ sqlplus / as sysdba

SQL*Plus: Release 12.2.0.1.0 Production on Thu Jul 30 11:30:34 2020

Copyright (c) 1982, 2016, Oracle. All rights reserved.


Connected to:
Oracle Database 12c Enterprise Edition Release 12.2.0.1.0 - 64bit Production

SYS@CDB12CR2>show pdbs

CON_ID CON_NAME OPEN MODE RESTRICTED
---------- ------------------------------ ---------- ----------
3 PDB12CR2 READ WRITE NO
SYS@CDB12CR2>alter session set container=cdb$root;

Session altered.

SYS@CDB12CR2>show pdbs

CON_ID CON_NAME OPEN MODE RESTRICTED
---------- ------------------------------ ---------- ----------
2 PDB$SEED READ ONLY NO
3 PDB12CR2 READ WRITE NO
SYS@CDB12CR2>

And as you can see, the trigger works as expected right, it’s not a rocket science as it gets the context environment variable value and alters the session´s container.

Thanks and until next time.

Cheers.

Elisson Almeida


Note:

Right after I wrote this post, I went to look for more information on ORACLE_PDB_SID and found another post from Mike Dietrichde which also shows the trigger code and some pitfalls that you must be aware.

Autonomous Health Framework – TFA events, changes and set

Continuing on this series, there are 2 commands which are very useful and we’ll see today: “events” and “changes”. Besides “set”, which we’ll cover too.

On the events command you will be able to drill down to a specific date and time, passing a specific component if needed as well you can check a database or instance as well. Using the last option you can, this is very useful when you want to see a history for the system and lists all important events in the system:

Usage : /oraadm/dba/ahf/oracle.ahf/tfa/bin/tfactl events [-search <keyword> | -component <ASM|CRS> | -database <db_name> | -instance <db_instance_name> | -source <filename> | -from <time> -to <time> | -json | -fields all|<fields_list> ]
-component [ASM|CRS] Searches all ASM or CRS events
-database Searches all events from a particular database
-instance Searches all events from a particular instance
-source Searches all events from a particular alert file
-json Outputs event information in JSON format
-fields When provided with the -json option, the command will only return the requested fields
-from "Mon/dd/yyyy hh:mm:ss" From <time>
or "yyyy-mm-dd hh:mm:ss"
or "yyyy-mm-ddThh:mm:ss"
or "yyyy-mm-dd"
-to "Mon/dd/yyyy hh:mm:ss" To <time>
or "yyyy-mm-dd hh:mm:ss"
or "yyyy-mm-ddThh:mm:ss"
or "yyyy-mm-dd"
-for "Mon/dd/yyyy" For <date>
or "yyyy-mm-dd"
-last <n><h|d>

[root@servertst01 bin]# ./tfactl events -last 30d -database dbaseprd


Output from host : servertst02
------------------------------

Event Summary:
INFO :7
ERROR :3
WARNING :0

Event Timeline:
[Apr/24/2020 01:43:06.000]: [db.dbaseprd.dbaseprd2]: Reconfiguration started (old inc 21, new inc 23)
[Apr/24/2020 02:09:47.000]: [db.dbaseprd.dbaseprd2]: Reconfiguration started (old inc 23, new inc 25)
[Apr/24/2020 02:12:36.000]: [db.dbaseprd.dbaseprd2]: Instance terminated by USER, pid = 246331
[Apr/24/2020 02:12:36.000]: [db.dbaseprd.dbaseprd2]: Shutting down instance (abort)
[Apr/24/2020 02:28:29.000]: [db.dbaseprd.dbaseprd2]: Starting ORACLE instance (normal)
[Apr/24/2020 02:28:37.000]: [db.dbaseprd.dbaseprd2]: Reconfiguration started (old inc 0, new inc 29)
[Apr/24/2020 02:31:06.000]: [db.dbaseprd.dbaseprd2]: Reconfiguration started (old inc 29, new inc 31)
[Apr/24/2020 03:14:38.000]: [db.dbaseprd.dbaseprd2]: Reconfiguration started (old inc 31, new inc 33)
[Apr/25/2020 11:46:12.000]: [db.dbaseprd.dbaseprd2]: ORA-00060: deadlock detected while waiting for resource
[May/07/2020 04:18:24.000]: [db.dbaseprd.dbaseprd2]: ORA-08103: object no longer exists

Output from host : servertst03
------------------------------

Event Summary:
INFO :7
ERROR :5
WARNING :0

Event Timeline:
[Apr/16/2020 04:12:25.000]: [db.dbaseprd.dbaseprd3]: ORA-08103: object no longer exists
[Apr/23/2020 04:12:17.000]: [db.dbaseprd.dbaseprd3]: ORA-08103: object no longer exists
[Apr/24/2020 01:43:06.000]: [db.dbaseprd.dbaseprd3]: Reconfiguration started (old inc 21, new inc 23)
[Apr/24/2020 02:09:47.000]: [db.dbaseprd.dbaseprd3]: Reconfiguration started (old inc 23, new inc 25)
[Apr/24/2020 02:12:37.000]: [db.dbaseprd.dbaseprd3]: Reconfiguration started (old inc 25, new inc 27)
[Apr/24/2020 02:28:38.000]: [db.dbaseprd.dbaseprd3]: Reconfiguration started (old inc 27, new inc 29)
[Apr/24/2020 02:31:05.000]: [db.dbaseprd.dbaseprd3]: Instance terminated by USER, pid = 6814
[Apr/24/2020 02:31:05.000]: [db.dbaseprd.dbaseprd3]: Shutting down instance (abort)
[Apr/24/2020 03:14:28.000]: [db.dbaseprd.dbaseprd3]: Starting ORACLE instance (normal)
[Apr/24/2020 03:14:37.000]: [db.dbaseprd.dbaseprd3]: Reconfiguration started (old inc 0, new inc 33)
[Apr/28/2020 10:12:44.000]: [db.dbaseprd.dbaseprd3]: ORA-00060: deadlock detected while waiting for resource
[May/10/2020 13:40:21.000]: [db.dbaseprd.dbaseprd3]: ORA-00060: deadlock detected while waiting for resource

Output from host : servertst01
------------------------------

Event Summary:
INFO :8
ERROR :2
WARNING :0

Event Timeline:
[Apr/24/2020 01:43:05.000]: [db.dbaseprd.dbaseprd1]: Instance terminated by USER, pid = 37711
[Apr/24/2020 01:43:05.000]: [db.dbaseprd.dbaseprd1]: Shutting down instance (abort)
[Apr/24/2020 02:09:38.000]: [db.dbaseprd.dbaseprd1]: Starting ORACLE instance (normal)
[Apr/24/2020 02:09:46.000]: [db.dbaseprd.dbaseprd1]: Reconfiguration started (old inc 0, new inc 25)
[Apr/24/2020 02:12:37.000]: [db.dbaseprd.dbaseprd1]: Reconfiguration started (old inc 25, new inc 27)
[Apr/24/2020 02:28:39.000]: [db.dbaseprd.dbaseprd1]: Reconfiguration started (old inc 27, new inc 29)
[Apr/24/2020 02:31:06.000]: [db.dbaseprd.dbaseprd1]: Reconfiguration started (old inc 29, new inc 31)
[Apr/24/2020 03:14:38.000]: [db.dbaseprd.dbaseprd1]: Reconfiguration started (old inc 31, new inc 33)
[Apr/24/2020 14:40:10.000]: [db.dbaseprd.dbaseprd1]: Incident details in: /oraadm/dbaseprd/admin/traces/diag/rdbms/dbaseprd/dbaseprd1/incident/incdir_115657/dbaseprd1_ora_151392_i115657.trc
[Apr/24/2020 14:40:10.000]: [db.dbaseprd.dbaseprd1]: ORA-00600: internal error code, arguments: [pevmexe.c: ENTER: which perc?], [], [], [], [], [], [], [], [], [], [], []

[root@servertst01 bin]#

The “changes” command, this shows the changes in the system, as I did not have any changes made after the TFA was installed was not able to reproduce it here. It lists all changes in the system:

Usage : /oraadm/dba/ahf/oracle.ahf/tfa/bin/tfactl changes [ -from <time> -to <time> | -for <time> | last <time_length> ]
-from "Mon/dd/yyyy hh:mm:ss" From <time>
or "yyyy-mm-dd hh:mm:ss"
or "yyyy-mm-ddThh:mm:ss"
or "yyyy-mm-dd"
-to "Mon/dd/yyyy hh:mm:ss" To <time>
or "yyyy-mm-dd hh:mm:ss"
or "yyyy-mm-ddThh:mm:ss"
or "yyyy-mm-dd"
-for "Mon/dd/yyyy" For <date>
or "yyyy-mm-dd"
-last <n><h|d>

Another way to see the changes in your environment is to use the search command passing a part to it and a specific component.

[root@servertst01 bin]# ./tfactl analyze -search "ALTER" -comp db
INFO: analyzing db (DB Alert Logs) logs for the last 60 minutes... Please wait...
INFO: analyzing host: servertst01

Report title: DB Alert Logs
Report date range: last ~1 hour(s)
Report (default) time zone: WET - Western European Time
Analysis started at: 11-May-2020 03:04:17 PM WEST
Elapsed analysis time: 2 second(s).
Configuration file: /oraadm/dba/ahf/oracle.ahf/tfa/ext/tnt/conf/tnt.prop
Configuration group: db
Parameter: ALTER
Total message count: 44,397, from 10-Feb-2020 01:19:51 PM WET to 11-May-2020 03:01:46 PM WEST
Messages matching last ~1 hour(s): 18, from 11-May-2020 02:17:23 PM WEST to 11-May-2020 03:01:46 PM WEST
Matching regex: ALTER
Case sensitive: false
Match count: 1
May 11 15:01:46 2020 - generic - ALTER SYSTEM SET open_cursors=6000 SCOPE=BOTH SID='*';

INFO: analyzing db (DB Alert Logs) logs for the last 60 minutes... Please wait...
INFO: analyzing host: servertst02

Report title: DB Alert Logs
Report date range: last ~1 hour(s)
Report (default) time zone: WET - Western European Time
Analysis started at: 11-May-2020 03:04:23 PM WEST
Elapsed analysis time: 0 second(s).
Configuration file: /oraadm/dba/ahf/oracle.ahf/tfa/ext/tnt/conf/tnt.prop
Configuration group: db
Parameter: ALTER
Total message count: 3,598, from 10-Feb-2020 03:03:42 PM WET to 11-May-2020 02:30:16 PM WEST
Messages matching last ~1 hour(s): 5, from 11-May-2020 02:30:05 PM WEST to 11-May-2020 02:30:16 PM WEST
Matching regex: ALTER
Case sensitive: false
Match count: 2
May 11 14:30:05 2020 - generic - ALTER SYSTEM ARCHIVE LOG
May 11 14:30:16 2020 - generic - ALTER SYSTEM ARCHIVE LOG
Thread 2 advanced to log sequence 1096 (LGWR switch)
Current log# 4 seq# 1096 mem# 0: +REDO1/testdba/onlinelog/group_4.274.1032015207
Current log# 4 seq# 1096 mem# 1: +REDO2/testdba/onlinelog/group_4.274.1032015207

INFO: analyzing db (DB Alert Logs) logs for the last 60 minutes... Please wait...
INFO: analyzing host: servertst03

Report title: DB Alert Logs
Report date range: last ~1 hour(s)
Report (default) time zone: WET - Western European Time
Analysis started at: 11-May-2020 03:04:25 PM WEST
Elapsed analysis time: 0 second(s).
Configuration file: /oraadm/dba/ahf/oracle.ahf/tfa/ext/tnt/conf/tnt.prop
Configuration group: db
Parameter: ALTER
Total message count: 1,687, from 19-Mar-2020 06:28:29 PM WET to 11-May-2020 02:30:18 PM WEST
Messages matching last ~1 hour(s): 4, from 11-May-2020 02:30:06 PM WEST to 11-May-2020 02:30:18 PM WEST
Matching regex: ALTER
Case sensitive: false
Match count: 0

And for last the set command which will configure several options for TFA:

[root@servertst01 bin]# ./tfactl set -h

Usage : tfact set ahfnotificationaddress="<space separated email ids>"
ahfnotificationaddress="<email1> <email2>" set AHF Notification Address

Turn ON/OFF or Modify various TFA features

Usage : /oraadm/dba/ahf/oracle.ahf/tfa/bin/tfactl set [ autodiagcollect=<ON|OFF> | trimfiles=<ON|OFF> | tracelevel=<COLLECT|SCAN|INVENTORY|OTHER|ISA|HANDLER|MAIN|CLIENT|CONSOLE>:<FATAL|ERROR|WARN|INFO|DEBUG|TRACE> | reposizeMB=<n> [repositorydir=<dir>] [-force] | repositorydir=<dir> [reposizeMB=<n>] [-force] | logsize=<n> [-local] | logcount=<n> [-local] | maxcorefilesize=<n> [-local] | maxcorecollectionsize=<n> [-local] | maxfilecollectionsize=<n> | autopurge=<ON|OFF> | publicip=<ON|OFF> | minSpaceForRTScan=<n> | rtscan=<ON|OFF> | diskUsageMon=<ON|OFF> | diskUsageMonInterval=<n> | manageLogsAutoPurge=<ON|OFF> | manageLogsAutoPurgeInterval=<n> | manageLogsAutoPurgePolicyAge=<d|h> | minagetopurge=<n> | tfaIpsPoolSize=<n> | tfaDbUtlPurgeAge=<n> | tfaDbUtlPurgeMode=<simple|resource|profile> | tfaDbUtlPurgeThreadDelay=<n> | tfaDbUtlCrsProfileDelay=<n> | indexRecoveryMode=<recreate|restore>] [-c]

autodiagcollect allow for automatic diagnostic collection when an event
is observed (default ON)
trimfiles allow trimming of files during diagcollection (default ON)
tracelevel control the trace level of log files in /oraadm/dba/ahf/oracle.ahf/data/servertst01/diag/tfa
(default INFO for all facilities)
reposizeMB=<n> set the maximum size of diagcollection repository to <n>MB
repositorydir=<dir> set the diagcollection repository to <dir>
-force skip inital checks while changing repository (Not Recommended)
logsize=<n> set the maximum size of each TFA log to <n>MB (default 50 MB)
logcount=<n> set the maximum number of TFA logs to <n> (default 10)
port=<n> set TFA Port to <n>
maxcorefilesize=<n> set the maximum size of Core File to <n>MB (default 20 MB )
maxcorecollectionsize=<n> set the maximum collection size of Core Files to <n>MB (default 200 MB )
maxfilecollectionsize=<n> set the maximum file collection size to <n>MB (default 5 GB )
autopurge allow automatic purging of collections when less space
is observed in repository (default OFF)
publicip allow TFA to run on public network
smtp Update SMTP Configuration
minSpaceForRTScan=<n> Minimun space required to run RT Scanning(default 500)
rtscan allow Alert Log Scanning
diskUsageMon allow Disk Usage Monitoring
diskUsageMonInterval=<n> Time interval between consecutive Disk Usage Snapshot(default 60 minutes)
manageLogsAutoPurge allow Manage Log Auto Purging
manageLogsAutoPurgeInterval=<n> Time interval between consecutive Managelogs Auto Purge(default 60 minutes)
manageLogsAutoPurgePolicyAge=<d|h> Logs older than the time period will be auto purged(default 30 days)
minagetopurge set the age in hours for collections to be skipped by
AutoPurge (default 12 Hours)
tfaIpsPoolSize set the TFA IPS pool size
tfaDbUtlPurgeAge set the TFA ISA Purge Age (in seconds)
tfaDbUtlPurgeMode set the TFA ISA Purge Mode (simple/resource)
tfaDbUtlPurgeThreadDelay set the TFA ISA Purge Thread Delay (in minutes)
tfaDbUtlCrsProfileDelay set the TFA ISA Crs Profile Delay
indexRecoveryMode set the Lucene index recovery mode (recreate/restore)
rediscoveryInterval set the time interval for running lite rediscovery
-c set the value on all nodes (Does not apply to repository
settings)
-local set the value on the local node (if option is not included
the value will be set on all the nodes)
Examples:
/oraadm/dba/ahf/oracle.ahf/tfa/bin/tfactl set autodiagcollect=ON
/oraadm/dba/ahf/oracle.ahf/tfa/bin/tfactl set autopurge=ON
/oraadm/dba/ahf/oracle.ahf/tfa/bin/tfactl set tracelevel=INVENTORY:3
/oraadm/dba/ahf/oracle.ahf/tfa/bin/tfactl set reposizeMB=20480
/oraadm/dba/ahf/oracle.ahf/tfa/bin/tfactl set logsize=100
/oraadm/dba/ahf/oracle.ahf/tfa/bin/tfactl set port=5000

Hope it helps, there are still many scenarios of TFA which I would like to bring but not that much time, I will try to make long posts for the next ones. We´ll see.

Thanks for reading!

Elisson Almeida

Autonomous Health Framework – Managing logs and REST API

Hi all,

We are used to use adrci to manage our database logs right, if you don’t about adrci please check here and here.

But did you know that TFA can cleanup the CRS and database logs as well?

You might be thinking: 2 set of tools for the same job? Yyeah kind off… =)

Adrci is configurable and performs the purges per configured policy and tfactl managelogs will not. Also the tfactl managelogs will also clean the listener logs as well and you can clean all cluster logs from one node without having to connect to each server to execute the purge from adrci for example.

The cleanup can be done by database or GI which comes in handy as well.

You have a dry run option which will show what will be deleted and total freed space without actually deleting any files

Usage : /oraadm/dba/ahf/oracle.ahf/tfa/bin/tfactl [run] managelogs [ -purge [[-older <n><m|h|d>] | [-gi] | [-database <all|d1,d2..>] | [-dryrun] ]] [ -show [usage|variation] [ [-older <n><d>] | [-gi] | [-database <all|d1,d2..>] ] ] [-node <all|local|node1,node2..>]

Options:
-purge           Purge logs
   -older        Timeperiod for log purge
   -gi           Purge Grid Infrastructure logs(all ADR homes under GIBASE/diag and crsdata(cvu dirs))
   -database     Purge Database logs (Default all else provide list)
   -dryrun       Estimate logs which will be cleared by purge command
-show            Print usage/variation details
   -older         Timeperiod for change in log volume
   -gi           Space utilization under GIBASE
   -database     Space utilization for Database logs (Default all else provide list)


 -older <n><m|h|d>  Files from past 'n' [d]ays or 'n' [h]ours or 'n' [m]inutes


e.g:
   /oraadm/dba/ahf/oracle.ahf/tfa/bin/tfactl managelogs -purge -older 30d -dryrun
   /oraadm/dba/ahf/oracle.ahf/tfa/bin/tfactl managelogs -purge -older 30d
   /oraadm/dba/ahf/oracle.ahf/tfa/bin/tfactl managelogs -show usage

   /oraadm/dba/ahf/oracle.ahf/tfa/bin/tfactl run managelogs -purge -older 30d -dryrun
   /oraadm/dba/ahf/oracle.ahf/tfa/bin/tfactl run managelogs -purge -older 30d
   /oraadm/dba/ahf/oracle.ahf/tfa/bin/tfactl run managelogs -show usage


TFA also comes with a REST API which you can use POST and GET http which you need to setup prior usage, it will setup 2 users, tfaadmin and tfarest, and start a ORDS service on the server.

[root@servertst01 bin]# ./tfactl rest status

TFA REST Services is not running

[root@servertst01 bin]# ./tfactl rest start

TFA REST Services is not running

[root@servertst01 bin]# ./tfactl rest -start

Configuring TFA REST Services using ORDS :

This might take couple of minutes. Please be patient.

Adding Dependency Jars to ORDS

Adding users to ORDS :

Password must be at least 8 characters and contain a combination of Upper case and Lower case letters, numbers and one of [!@#%_]

Enter a password for user tfaadmin:
Confirm password for user tfaadmin:

Enter a password for user tfarest:
Confirm password for user tfarest:

Starting TFA REST Services

Successfully started TFA REST Services [PID : 158682]

TFA URL : https://servertest01:9090/ords/tfactl/print/status

COMPLIANCE URL : https://servertest01:9090/ords/tfactl/orachk/version


The commands are most like the ones from the CLI but using this REST API, you will receive JSON outputs which you can process and automate the use of TFA

Below are some examples

/tfactl/print/status

[root@servertst01 ~]$ curl -k --user tfaadmin:tfaadmin https://servertst01:9090/ords/tfactl/print/status
[ {
"status" : "CheckOK",
"hostname" : "servertst01",
"pid" : 135195,
"port" : 5000,
"version" : "20.1.3.0.0",
"buildId" : "20130020200429095054",
"inventoryStatus" : "COMPLETE"
}, {
"status" : "CheckOK",
"hostname" : "servertst02",
"pid" : 241723,
"port" : 5000,
"version" : "20.1.3.0.0",
"buildId" : "20130020200429095054",
"inventoryStatus" : "COMPLETE"
} ]

/print/actions

[root@servertst01 ~]$ curl -k --user tfaadmin:tfaadmin https://servertst01:9090/ords/tfactl/print/actions
[ {
"actionName" : "Run inventory",
"hostname" : "servertst01",
"client" : "DiagCollectionThread",
"startTime" : "May 13 15:48:52 WEST",
"endTime" : "May 13 15:49:58 WEST",
"status" : "COMPLETE",
"comments" : "<components><component><name>EMAGENT</name></component><component><name>DBCLIENT</name></component><component><name>ACFS</name></component><component><name>RDBMS</name></component><component><name>OS</name></component><component><name>CRS</name></component><component><name>EM</name></component><component><name>ASMPROXY</name></component><component><name>ASMIO</name></component><component><name>CRSCLIENT</name></component><component><name>OMS</name></component><component><name>DBWLM</name></component><component><name>INSTALL</name></component><component><name>TNS</name></component><component><name>OCM</name></component><component><name>ASM</name></component><component><name>RHP</name></component><component><name>CHA</name></component><component><name>AFD</name></component><component><name>EMPLUGINS</name></component><component><name>CFGTOOLS</name></component><component><name>WLS</name></component></components>"
}, {
"actionName" : "Collect traces",
"hostname" : "servertst01",
"client" : "tfactl",
"startTime" : "May 13 15:48:51 WEST",
"endTime" : "May 13 15:53:21 WEST",
"status" : "COMPLETE",
"comments" : "-database all -rdbms -asm -crsclient -dbclient -dbwlm -tns -rhp -afd -crs -wls -emagent -oms -ocm -emplugins -em -acfs -install -cfgtools -os -sundiag -chmos -monitor -copy -since 12h -node all -z TFA_DEF_ZIP_20200513154851 -user root -tag TFA_DEF_TAG_20200513154851 -logid 20200513154851:20200513154851servertst01"
}, {
"actionName" : "Run inventory",
"hostname" : "servertst01",
"client" : "DiagCollectionThread",
"startTime" : "May 13 15:47:48 WEST",
"endTime" : "May 13 15:48:20 WEST",
"status" : "COMPLETE",
"comments" : "<components><component><name>EMAGENT</name></component><component><name>DBCLIENT</name></component><component><name>ACFS</name></component><component><name>RDBMS</name></component><component><name>OS</name></component><component><name>CRS</name></component><component><name>EM</name></component><component><name>ASMPROXY</name></component><component><name>ASMIO</name></component><component><name>CRSCLIENT</name></component><component><name>OMS</name></component><component><name>DBWLM</name></component><component><name>INSTALL</name></component><component><name>TNS</name></component><component><name>OCM</name></component><component><name>ASM</name></component><component><name>RHP</name></component><component><name>CHA</name></component><component><name>AFD</name></component><component><name>EMPLUGINS</name></component><component><name>CFGTOOLS</name></component><component><name>WLS</name></component></components>"
}, {
"actionName" : "Collect traces",
"hostname" : "servertst01",
"client" : "tfactl",
"startTime" : "May 13 15:47:48 WEST",
"endTime" : "May 13 15:52:29 WEST",
"status" : "COMPLETE",
"comments" : "-database all -rdbms -asm -crsclient -dbclient -dbwlm -tns -rhp -afd -crs -wls -emagent -oms -ocm -emplugins -em -acfs -install -cfgtools -os -sundiag -chmos -monitor -copy -since 12h -node all -z TFA_DEF_ZIP_20200513154748 -user root -tag TFA_DEF_TAG_20200513154748 -logid 20200513154748:20200513154748servertst01"
}, {
"actionName" : "Run inventory",
"hostname" : "servertst02",
"client" : "DiagCollectionThread",
"startTime" : "May 13 15:48:54 WEST",
"endTime" : "May 13 15:49:04 WEST",
"status" : "COMPLETE",
"comments" : "<components><component><name>EMAGENT</name></component><component><name>DBCLIENT</name></component><component><name>ACFS</name></component><component><name>RDBMS</name></component><component><name>OS</name></component><component><name>CRS</name></component><component><name>EM</name></component><component><name>ASMPROXY</name></component><component><name>ASMIO</name></component><component><name>CRSCLIENT</name></component><component><name>OMS</name></component><component><name>DBWLM</name></component><component><name>INSTALL</name></component><component><name>OCM</name></component><component><name>TNS</name></component><component><name>ASM</name></component><component><name>RHP</name></component><component><name>CHA</name></component><component><name>AFD</name></component><component><name>EMPLUGINS</name></component><component><name>CFGTOOLS</name></component><component><name>WLS</name></component></components>"
}, {
"actionName" : "Collect traces",
"hostname" : "servertst02",
"client" : "tfactl",
"startTime" : "May 13 15:48:53 WEST",
"endTime" : "May 13 15:53:27 WEST",
"status" : "COMPLETE",
"comments" : "-timezone Europe/Lisbon -nodelist servertst02_servertst01 -s 05.13.2020.03.48 -e 05.13.2020.15.48 -updateendtime -z TFA_DEF_ZIP_20200513154851.zip -tag TFA_DEF_TAG_20200513154851 -logid 20200513154851 -emagent -dbclient -acfs -rdbms -os -crs -em -asmproxy -asmio -crsclient -oms -dbwlm -install -tns -ocm -asm -rhp -cha -afd -emplugins -cfgtools -wls -chmos -copy -user root -uid 9a79d417-a877-4355-a2f2-210f1d45024a:20200513154851servertst01"
}, {
"actionName" : "Run inventory",
"hostname" : "servertst02",
"client" : "DiagCollectionThread",
"startTime" : "May 13 15:47:50 WEST",
"endTime" : "May 13 15:48:12 WEST",
"status" : "COMPLETE",
"comments" : "<components><component><name>EMAGENT</name></component><component><name>DBCLIENT</name></component><component><name>ACFS</name></component><component><name>RDBMS</name></component><component><name>OS</name></component><component><name>CRS</name></component><component><name>EM</name></component><component><name>ASMPROXY</name></component><component><name>ASMIO</name></component><component><name>CRSCLIENT</name></component><component><name>OMS</name></component><component><name>DBWLM</name></component><component><name>INSTALL</name></component><component><name>OCM</name></component><component><name>TNS</name></component><component><name>ASM</name></component><component><name>RHP</name></component><component><name>CHA</name></component><component><name>AFD</name></component><component><name>EMPLUGINS</name></component><component><name>CFGTOOLS</name></component><component><name>WLS</name></component></components>"
}, {
"actionName" : "Collect traces",
"hostname" : "servertst02",
"client" : "tfactl",
"startTime" : "May 13 15:47:49 WEST",
"endTime" : "May 13 15:52:37 WEST",
"status" : "COMPLETE",
"comments" : "-timezone Europe/Lisbon -nodelist servertst02_servertst01 -s 05.13.2020.03.47 -e 05.13.2020.15.47 -updateendtime -z TFA_DEF_ZIP_20200513154748.zip -tag TFA_DEF_TAG_20200513154748 -logid 20200513154748 -emagent -dbclient -acfs -rdbms -os -crs -em -asmproxy -asmio -crsclient -oms -dbwlm -install -tns -ocm -asm -rhp -cha -afd -emplugins -cfgtools -wls -chmos -copy -user root -uid 94229462-6332-4a7e-849b-9469c1ad86ef:20200513154748servertst01"
} ]

/tfactl/diagcollect

[root@servertst01 ~]$ curl -k --user tfaadmin:tfaadmin https://servertst01:9090/ords/tfactl/diagcollect
{
"collectionId" : "20200513161625servertst01",
"zipName" : "TFA_DEF_ZIP_20200513161625",
"tagName" : "TFA_DEF_TAG_20200513161625",
"message" : [ "Diagcollect request will be processed soon by TFA" ]
}


You can download the report using the collectionId as below

curl -k --user tfaadmin:tfaadmin -L0 https://servertst01:9090/ords/tfactl/download/20200513161625servertst01 --output remoteTFA.zip

 % Total % Received % Xferd Average Speed Time Time Time Current
Dload Upload Total Spent Left Speed
100 196M 0 196M 0 0 195M 0 --:--:-- 0:00:01 --:--:-- 195M

On the next ones I will do a review on a ORACHK and OSWatcher which are also part of the Autonomous Health Framework

I Hope it helps!

Elisson Almeida

Autonomous Health Framework – OSWatcher

Hi all,

Another one for our series about Autonomous Health Framework:

Along with the AHF, we have some tools that we can take advantage of, one of them is OSWatcher. OSwatcher is a utility to capture performance metrics from the operating system using native OS tools for IO, network, CPU, memory, etc.

It gathers a snapshot of your system and stores it in a directory which you can then use it to parse the information there and perform a system wide analysis.

You can stop it if you want, out of the box it will gather OS information every 30 minutes

To see if it is running you can use tfactl toolstatus as below

[root@servertst01 bin]# ./tfactl toolstatus

.------------------------------------------------------------------.
| TOOLS STATUS - HOST : servertst01 |
+----------------------+--------------+--------------+-------------+
| Tool Type | Tool | Version | Status |
+----------------------+--------------+--------------+-------------+
| Development Tools | orachk | 19.3.0.0.0 | DEPLOYED |
| | oratop | 14.1.2 | DEPLOYED |
+----------------------+--------------+--------------+-------------+
| Support Tools Bundle | darda | 2.10.0.R6036 | DEPLOYED |
| | oswbb | 8.3.2 | RUNNING |
| | prw | 12.1.13.11.4 | NOT RUNNING |
+----------------------+--------------+--------------+-------------+
| TFA Utilities | alertsummary | 19.3.0.0.0 | DEPLOYED |
| | calog | 19.3.0.0.0 | DEPLOYED |
| | dbcheck | 18.3.0.0.0 | DEPLOYED |
| | dbglevel | 19.3.0.0.0 | DEPLOYED |
| | grep | 19.3.0.0.0 | DEPLOYED |
| | history | 19.3.0.0.0 | DEPLOYED |
| | ls | 19.3.0.0.0 | DEPLOYED |
| | managelogs | 19.3.0.0.0 | DEPLOYED |
| | menu | 19.3.0.0.0 | DEPLOYED |
| | param | 19.3.0.0.0 | DEPLOYED |
| | ps | 19.3.0.0.0 | DEPLOYED |
| | pstack | 19.3.0.0.0 | DEPLOYED |
| | summary | 19.3.0.0.0 | DEPLOYED |
| | tail | 19.3.0.0.0 | DEPLOYED |
| | triage | 19.3.0.0.0 | DEPLOYED |
| | vi | 19.3.0.0.0 | DEPLOYED |
'----------------------+--------------+--------------+-------------'

Note :-
DEPLOYED : Installed and Available - To be configured or run interactively.
NOT RUNNING : Configured and Available - Currently turned off interactively.
RUNNING : Configured and Available.

[root@servertst01 bin]#

And to run a simple test you can call tfactl oswbb and it should parse all data in its archive directory BUT and I tried to do so I ran into a java out of memory error
I bumped the memory of the process up to 4G and still gor the same error.

If you want to try to increase your process memory you will need to edit the file oswbb.pm under oracle.ahf/tfa/ext/oswbb

You will see a line like below, and you will need to change the memory valeu to one that your system can handle, I´m not saying it will not work you can try.

system("$java -Xmx512M -jar $oswjar -i $adir @flags");

Here is the error:

[root@servertst01 bin]# ./tfactl oswbb

Starting OSW Analyzer V8.3.0
OSWatcher Analyzer Written by Oracle Center of Expertise
Copyright (c) 2019 by Oracle Corporation

Parsing Data. Please Wait...

Scanning file headers for version and platform info...


Exception in thread "main" java.lang.OutOfMemoryError: GC overhead limit exceeded
at u.c(Unknown Source)
at u.a(Unknown Source)
at OSWGraph.OSWGraph.main(Unknown Source)


Analysis results are saved in /oraadm/oracrs/product/19.0.0/ahf/oracle.ahf/data/repository/suptools/servertst01/oswbb/root/oswbb

And there process memory which was a bit ovee 4G when it died

[root@servertst01 ~]$ ps -eo rss,pid,euser,lstart,args:100 --sort %mem | grep -v grep | grep java | awk '{printf $1/1024 "MB"; $1=""; print }'| sort |grep osw
4364.3MB 103531 root Wed May 13 18:09:12 2020 /oraadm/oracrs/product/19.0.0/ahf/oracle.ahf/jre/bin/java -Xmx4096M -jar /oraadm/oracrs/product/19.0.0/ahf/oracle.ahf/data/repository/suptools/servertst01/oswbb/root/oswbb/oswbba.jar -i /oraadm/oracrs/product/19.0.0/ahf/oracle.ahf/data/repository/suptools/servertst01/oswbb/oracrs/archive

I had over 4 days of data there, so by using the options -B and -E I was able to workaround the issue. If you are doing some troubleshooting I would advise to read 4 days of data anyway as we could be see averages and a spike could be reduced and not see in the analysis.
So it did not bothered that much.

Here when passing the date range I was able to execute the process as needed.

[root@servertst01 bin]# ./tfactl oswbb -6 -B May 13 09:25:00 2020 -E May 13 09:30:00 2020

Validating times in the archive...


Starting OSW Analyzer V8.3.0
OSWatcher Analyzer Written by Oracle Center of Expertise
Copyright (c) 2019 by Oracle Corporation

Parsing Data. Please Wait...

Scanning file headers for version and platform info...


Parsing file servertst01_pidstat_20.05.13.0900.dat ...

Parsing file servertst01_iostat_20.05.13.0900.dat ...
This directory already exists. Rewriting...

Parsing file servertst01_vmstat_20.05.13.0900.dat ...

Parsing file servertst01_netstat_20.05.13.0900.dat ...

Parsing file servertst01_top_20.05.13.0900.dat ...

Parsing file servertst01_ps_20.05.13.0900.dat ...


Parsing Completed.


Enter 1 to Display CPU Process Queue Graphs
Enter 2 to Display CPU Utilization Graphs
Enter 3 to Display CPU Other Graphs
Enter 4 to Display Memory Graphs
Enter 5 to Display Disk IO Graphs
Enter 61 to Display Individual OS Process I/O RPS Graphs
Enter 62 to Display Individual OS Process I/O WPS Graphs
Enter 63 to Display Individual OS Process Percent User CPU Graphs
Enter 64 to Display Individual OS Process Percent System CPU Graphs
Enter 65 to Display Individual OS Process Percent Total CPU (User + System) Graphs
Enter 66 to Display Individual OS Process Percent Memory Graphs

Enter GP to Generate Individual Process Profile
Enter GC to Generate All CPU Gif Files
Enter GM to Generate All Memory Gif Files
Enter GD to Generate All Disk Gif Files
Enter GN to Generate All Network Gif Files

Enter L to Specify Alternate Location of Gif Directory
Enter Z to Zoom Graph Time Scale (Does not change analysis dataset)
Enter B to Returns to Baseline Graph Time Scale (Does not change analysis dataset)
Enter R to Remove Currently Displayed Graphs

Enter X to Export Parsed Data to Flat File
Enter S to Analyze Subset of Data(Changes analysis dataset including graph time scale)
Enter A to Analyze Data
Enter D to Generate DashBoard

Enter Q to Quit Program

Please Select an Option:

Hope it helps!

Elisson Almeida

Autonomous Health Framework – TFA data collection

Hi all,

Here I am or another post on the Autonomous Health Framework series!

Based on previous posts, we now have the AHF installed, what can we do with it?
I would say a lot! Everything? I don’t think so.

I will post here what I usually use more on TFA and then I will focus on orachk (which is a monster on its own as well).

Imagine that you have a problem and need to gather different information from the OS and the Oracle Stack from different nodes?

That´s where TFA – Trace file analyzer comes into play. It will collect the data for you and if you run as its root. You can specify the component that you need if you need to drill down to a very specify issue.

Also when you have a Service request with MOS they will probably ask for it to be executed but if they don’t, you should do it and upload any way as it will save a lot of time to troubleshooting and back and forth messages.

And if you have Internet access, you can upload it using the TFA as well, see it here.

[root@servertst01 bin]# ./tfactl diagcollect –h

Invalid Option for diagcollect: –h

Collect logs from across nodes in cluster

Usage : /oraadm/oracrs/product/19.0.0/ahf/oracle.ahf/tfa/bin/tfactl diagcollect [ [component_name1] [component_name2] ... [component_nameN] | [-srdc ] | [-defips]] [-sr <SR#>] [-node <all|local|n1,n2,..>] [-tag ] [-z ] [-last <m|h|d>| -from  -to  | -for ] [-nocopy] [-notrim] [-silent] [-nocores][-collectalldirs][-collectdir <dir1,dir2..>][-examples]
components:-ips|-database|-asm|-crsclient|-dbclient|-dbwlm|-tns|-rhp|-procinfo|-cvu|-afd|-crs|-cha|-chastore|-wls|-emagent|-oms|-ocm|-emplugins|-em|-acfs|-install|-cfgtools|-os|-ashhtml|-ashtext|-awrhtml|-awrtext|-qos
-srdc Service Request Data Collection (SRDC).
-defips Include in the default collection the IPS Packages for:
ASM, CRS and Databases
-sr Enter SR number to which the collection will be uploaded
-node Specify comma separated list of host names for collection
-tag  The files will be collected into tagname directory inside
repository
-z  The collection zip file will be given this name within the
TFA collection repository
-last <m|h|d> Files from last 'n' [m]inutes, 'n' [d]ays or 'n' [h]ours
-since Same as -last. Kept for backward compatibility.
-from "Mon/dd/yyyy hh:mm:ss" From 
or "yyyy-mm-dd hh:mm:ss"
or "yyyy-mm-ddThh:mm:ss"
or "yyyy-mm-dd"
-to "Mon/dd/yyyy hh:mm:ss" To 
or "yyyy-mm-dd hh:mm:ss"
or "yyyy-mm-ddThh:mm:ss"
or "yyyy-mm-dd"
-for "Mon/dd/yyyy" For .
or "yyyy-mm-dd"
-nocopy Does not copy back the zip files to initiating node from all nodes
-notrim Does not trim the files collected
-silent This option is used to submit the diagcollection as a background
process
-nocores Do not collect Core files when it would normally have been
collected
-collectalldirs Collect all files from a directory marked "Collect All"
flag to true
-collectdir Specify comma separated list of directories and collection will
include all files from these irrespective of type and time constraints
in addition to components specified
-examples Show diagcollect usage examples
For detailed help on each component use:
/oraadm/oracrs/product/19.0.0/ahf/oracle.ahf/tfa/bin/tfactl diagcollect [component_name1] [component_name2] ... [component_nameN] -help
[root@servertst01 bin]#

[root@servertst01 bin]# ./tfactl diagcollect -examples
Examples:
/oraadm/oracrs/product/19.0.0/ahf/oracle.ahf/tfa/bin/tfactl diagcollect
Trim and Zip all files updated in the last 12 hours as well as chmos/osw data
from across the cluster and collect at the initiating node
Note: This collection could be larger than required but is there as the
simplest way to capture diagnostics if an issue has recently occurred.

/oraadm/oracrs/product/19.0.0/ahf/oracle.ahf/tfa/bin/tfactl diagcollect -last 8h
Trim and Zip all files updated in the last 8 hours as well as chmos/osw data
from across the cluster and collect at the initiating node

/oraadm/oracrs/product/19.0.0/ahf/oracle.ahf/tfa/bin/tfactl diagcollect -database hrdb,fdb -last 1d -z foo
Trim and Zip all files from databases hrdb & fdb in the last 1 day and
collect at the initiating node

/oraadm/oracrs/product/19.0.0/ahf/oracle.ahf/tfa/bin/tfactl diagcollect -crs -os -node node1,node2 -last 6h
Trim and Zip all crs files, o/s logs and chmos/osw data from node1 & node2
updated in the last 6 hours and collect at the initiating node

/oraadm/oracrs/product/19.0.0/ahf/oracle.ahf/tfa/bin/tfactl diagcollect -asm -node node1 -from "May/07/2020" -to "May/07/2020 21:00:00"
Trim and Zip all ASM logs from node1 updated between from and to time and
collect at the initiating node

/oraadm/oracrs/product/19.0.0/ahf/oracle.ahf/tfa/bin/tfactl diagcollect -for "May/07/2020"
Trim and Zip all log files updated on "May/07/2020" and collect at the
collect at the initiating node

/oraadm/oracrs/product/19.0.0/ahf/oracle.ahf/tfa/bin/tfactl diagcollect -for "May/07/2020 21:00:00"
Trim and Zip all log files updated from 09:00 on "May/07/2020" to 09:00 on "May/08/2020"
(i.e. 12 hours before and after the time given) and collect at the initiating node

/oraadm/oracrs/product/19.0.0/ahf/oracle.ahf/tfa/bin/tfactl diagcollect -crs -collectdir /tmp_dir1,/tmp_dir2
Trim and Zip all crs files updated in the last 12 hours
Also collect all files from /tmp_dir1 and /tmp_dir2 at the initiating node


Autonomous Health Framework – Installation and Usage Basics

Hi all,

So, this week we’ll have an Autonomous Health Framework series o posts! One post per day, stay tuned!

Today I’ll review some points of the Autonomous Health Framework and how it can help us on the day to day tasks as well as on specific problem resolutions. This framework is a bundle of tools that were already available like orachk/exachk, tfa plus other features that I will try to cover focusing on practical cases.

So, first of all, you need to install it, if you have a RAC cluster most likely you already have it but it is always good to update it, as Oracle security recommendations as also part of the orachk analyze. For reference: In an ideal world you have root access or sudo, as its daemons under root provides a more wide log collection capabilities.

  1. Download the latest version from Autonomous Health Framework (AHF) – Including TFA and ORAchk/EXAChk (Doc ID 2550798.1)
  2. Transfer and unzip the file to your server and as root follow the installation as below
root@servertst01 oracrs]# ./ahf_setup -ahf_loc /oraadm/oracrs/product/19.0.0/ahf -data_dir /oraadm/oracrs/product/19.0.0/ahf/data

AHF Installer for Platform Linux Architecture x86_64

AHF Installation Log : /tmp/ahf_install_120962_2020_05_07-22_41_11.log

Starting Autonomous Health Framework (AHF) Installation

AHF Version: 20.1.3 Build Date: 202004290950

TFA is already installed at : /oraadm/oracrs/product/19.0.0/tfa/servertst01/tfa_home

Installed TFA Version : 192000 Build ID : 20190426041420

AHF Location : /oraadm/oracrs/product/19.0.0/ahf/oracle.ahf

AHF Data Directory : /oraadm/oracrs/product/19.0.0/ahf/oracle.ahf/data

Shutting down TFA : /oraadm/oracrs/product/19.0.0/tfa/servertst01/tfa_home

Copying TFA Data Files from /oraadm/oracrs/product/19.0.0/tfa/servertst01/tfa_home

Uninstalling TFA : /oraadm/oracrs/product/19.0.0/tfa/servertst01/tfa_home

Do you want to add AHF Notification Email IDs ? [Y]|N : n

Login using root is disabled in sshd config. Installing AHF only on Local Node

Extracting AHF to /oraadm/oracrs/product/19.0.0/ahf/oracle.ahf

Configuring TFA Services

Copying TFA Data Files to AHF

Discovering Nodes and Oracle Resources

Starting TFA Services
Created symlink from /etc/systemd/system/multi-user.target.wants/oracle-tfa.service to /etc/systemd/system/oracle-tfa.service.
Created symlink from /etc/systemd/system/graphical.target.wants/oracle-tfa.service to /etc/systemd/system/oracle-tfa.service.

.---------------------------------------------------------------------------------.
| Host | Status of TFA | PID | Port | Version | Build ID |
+-------------+---------------+--------+------+------------+----------------------+
| servertst01 | RUNNING | 135195 | 5000 | 20.1.3.0.0 | 20130020200429095054 |
'-------------+---------------+--------+------+------------+----------------------'

Running TFA Inventory...

Adding default users to TFA Access list...

.--------------------------------------------------------------------------------------.
| Summary of AHF Configuration |
+-----------------+--------------------------------------------------------------------+
| Parameter | Value |
+-----------------+--------------------------------------------------------------------+
| AHF Location | /oraadm/oracrs/product/19.0.0/ahf/oracle.ahf |
| TFA Location | /oraadm/oracrs/product/19.0.0/ahf/oracle.ahf/tfa |
| Orachk Location | /oraadm/oracrs/product/19.0.0/ahf/oracle.ahf/orachk |
| Data Directory | /oraadm/oracrs/product/19.0.0/ahf/oracle.ahf/data |
| Repository | /oraadm/oracrs/product/19.0.0/ahf/oracle.ahf/data/repository |
| Diag Directory | /oraadm/oracrs/product/19.0.0/ahf/oracle.ahf/data/servertst01/diag |
'-----------------+--------------------------------------------------------------------'


Starting orachk daemon from AHF ...

AHF binaries are available in /oraadm/oracrs/product/19.0.0/ahf/oracle.ahf/bin

AHF is successfully installed

Moving /tmp/ahf_install_120962_2020_05_07-22_41_11.log to /oraadm/oracrs/product/19.0.0/ahf/oracle.ahf/data/servertst01/diag/ahf/

As you can see as the root user is not allowed to ssh, the installation was done only on the local node. Repeat the process on the remaning ones

Once you have it completed you will be able to to a tfactl status and a toolstatus and see the processes and tools available.
[root@servertst01 bin]# ./tfactl status

.----------------------------------------------------------------------------------------------------.
| Host | Status of TFA | PID | Port | Version | Build ID | Inventory Status |
+-------------+---------------+--------+------+------------+----------------------+------------------+
| servertst01 | RUNNING | 135195 | 5000 | 20.1.3.0.0 | 20130020200429095054 | COMPLETE |
| servertst02 | RUNNING | 241723 | 5000 | 20.1.3.0.0 | 20130020200429095054 | COMPLETE |
'-------------+---------------+--------+------+------------+----------------------+------------------'
[root@servertst01 bin]#
[root@servertst01 bin]# ./tfactl toolstatus

.------------------------------------------------------------------.
| TOOLS STATUS - HOST : servertst01 |
+----------------------+--------------+--------------+-------------+
| Tool Type | Tool | Version | Status |
+----------------------+--------------+--------------+-------------+
| Development Tools | orachk | 19.3.0.0.0 | DEPLOYED |
| | oratop | 14.1.2 | DEPLOYED |
+----------------------+--------------+--------------+-------------+
| Support Tools Bundle | darda | 2.10.0.R6036 | DEPLOYED |
| | oswbb | 8.3.2 | RUNNING |
| | prw | 12.1.13.11.4 | NOT RUNNING |
+----------------------+--------------+--------------+-------------+
| TFA Utilities | alertsummary | 19.3.0.0.0 | DEPLOYED |
| | calog | 19.3.0.0.0 | DEPLOYED |
| | dbcheck | 18.3.0.0.0 | DEPLOYED |
| | dbglevel | 19.3.0.0.0 | DEPLOYED |
| | grep | 19.3.0.0.0 | DEPLOYED |
| | history | 19.3.0.0.0 | DEPLOYED |
| | ls | 19.3.0.0.0 | DEPLOYED |
| | managelogs | 19.3.0.0.0 | DEPLOYED |
| | menu | 19.3.0.0.0 | DEPLOYED |
| | param | 19.3.0.0.0 | DEPLOYED |
| | ps | 19.3.0.0.0 | DEPLOYED |
| | pstack | 19.3.0.0.0 | DEPLOYED |
| | summary | 19.3.0.0.0 | DEPLOYED |
| | tail | 19.3.0.0.0 | DEPLOYED |
| | triage | 19.3.0.0.0 | DEPLOYED |
| | vi | 19.3.0.0.0 | DEPLOYED |
'----------------------+--------------+--------------+-------------'

Note :-
DEPLOYED : Installed and Available - To be configured or run interactively.
NOT RUNNING : Configured and Available - Currently turned off interactively.
RUNNING : Configured and Available.

[root@servertst01 bin]#

3. Using it you can ‘query’ all cluster nodes for information from a single point which can really speed up your information collection. Here is an example of the summary command:

[root@servertst01 bin]# ./tfactl summary -h
---------------------------------------------------------------------------------
Usage : TFACTL [run] summary -help
---------------------------------------------------------------------------------
Command : /oraptp/oracrs/product/19.0.0/ahf/oracle.ahf/tfa/bin/tfactl [run] summary [OPTIONS]
Following Options are supported:
        [no_components] : [Default] Complete Summary Collection
        -overview       : [Optional/Default] Complete Summary Collection - Overview
        -crs            : [Optional/Default] CRS Status Summary
        -asm            : [Optional/Default] ASM Status Summary
        -acfs           : [Optional/Default] ACFS Status Summary
        -database       : [Optional/Default] DATABASE Status Summary
        -exadata        : [Optional/Default] EXADATA Status Summary
                          Not enabled/ignored in Windows and Non-Exadata machine
        -patch          : [Optional/Default] Patch Details
        -listener       : [Optional/Default] LISTENER Status Summary
        -network        : [Optional/Default] NETWORK Status Summary
        -os             : [Optional/Default] OS Status Summary
        -tfa            : [Optional/Default] TFA Status Summary
        -summary        : [Optional/Default] Summary Tool Metadata

        -json           : [Optional] - Prepare json report
        -html           : [Optional] - Prepare html report
        -print          : [Optional] - Display [html or json] Report at Console
        -silent         : [Optional] - Interactive console by defauly
        -history <num>  : [Optional] - View Previous <numberof> Summary Collection History in Interpreter
        -node <node(s)> : [Optional] - local or Comma Separated Node Name(s)
        -help           : Usage/Help.
---------------------------------------------------------------------------------
  - Data Collection From Node - servertst02 .. Done.
[root@servertst01 bin]#

[root@servertst01 bin]# ./tfactl summary

  Executing Summary in Parallel on Following Nodes:
    Node : servertst01
    Node : servertst02

LOGFILE LOCATION : /oraadm/oracrs/product/19.0.0/ahf/oracle.ahf/data/repository/suptools/servertst01/summary/root/20200508124309/log/summary_command_20200508124309_servertst01_35756.log

  Component Specific Summary collection :
    - Collecting CRS details ... Done.
    - Collecting ASM details ... Done.
    - Collecting ACFS details ... Done.
    - Collecting DATABASE details ... Done.
    - Collecting PATCH details ... Done.
    - Collecting LISTENER details ... Done.
    - Collecting NETWORK details ... Done.
    - Collecting OS details ... Done.
    - Collecting TFA details ... Done.
    - Collecting SUMMARY details ... Done.

  Remote Summary Data Collection : In-Progress - Please wait ...
  - Data Collection From Node - servertst02 .. Done.

  Prepare Clusterwide Summary Overview ... Done
      cluster_status_summary

  COMPONENT   STATUS    DETAILS
+-----------+---------+---------------------------------------------------------------------------------------------------+
  CRS         PROBLEM   .-----------------------------------------------.
                        | CRS_SERVER_STATUS   : ONLINE                  |
                        | CRS_STATE           : ONLINE                  |
                        | CRS_INTEGRITY_CHECK : FAIL                    |
                        | CRS_RESOURCE_STATUS : OFFLINE Resources Found |
                        '-----------------------------------------------'
  ASM         PROBLEM   .-------------------------------------------------------.
                        | ASM_DISK_SIZE_STATUS : WARNING - Available Size < 20% |
                        | ASM_BLOCK_STATUS     : PASS                           |
                        | ASM_CHAIN_STATUS     : PASS                           |
                        | ASM_INCIDENTS        : PASS                           |
                        | ASM_PROBLEMS         : PASS                           |
                        '-------------------------------------------------------'
  ACFS        OFFLINE   .-----------------------.
                        | ACFS_STATUS : OFFLINE |
                        '-----------------------'
  DATABASE    PROBLEM   .-----------------------------------------------------------------------------------------------.
                        | ORACLE_HOME_DETAILS                                                        | ORACLE_HOME_NAME |
                        +----------------------------------------------------------------------------+------------------+
                        | .------------------------------------------------------------------------. | OraDb11g_home1   |
                        | | PROBLEMS | INCIDENTS | DB_BLOCKS | DATABASE_NAME | STATUS  | DB_CHAINS | |                  |
                        | +----------+-----------+-----------+---------------+---------+-----------+ |                  |
                        | | PROBLEM  | PROBLEM   | PASS      | FSIGNTST      | PROBLEM | PROBLEM   | |                  |
                        | '----------+-----------+-----------+---------------+---------+-----------' |                  |
                        '----------------------------------------------------------------------------+------------------'
  PATCH       OK        .----------------------------------------------.
                        | CRS_PATCH_CONSISTENCY_ACROSS_NODES      : OK |
                        | DATABASE_PATCH_CONSISTENCY_ACROSS_NODES : OK |
                        '----------------------------------------------'
  LISTENER    OK        .-----------------------.
                        | LISTNER_STATUS   : OK |
                        '-----------------------'
  NETWORK     OK        .---------------------------.
                        | CLUSTER_NETWORK_STATUS :  |
                        '---------------------------'
  OS          OK        .-----------------------.
                        | MEM_USAGE_STATUS : OK |
                        '-----------------------'
  TFA         OK        .----------------------.
                        | TFA_STATUS : RUNNING |
                        '----------------------'
  SUMMARY     OK        .-----------------------------------.
                        | SUMMARY_EXECUTION_TIME : 0H:2M:9S |
                        '-----------------------------------'
+-----------+---------+---------------------------------------------------------------------------------------------------+


        ### Entering in to SUMMARY Command-Line Interface ###

tfactl_summary>list

  Components : Select Component - select [component_number|component_name]
        1 => overview
        2 => crs_overview
        3 => asm_overview
        4 => acfs_overview
        5 => database_overview
        6 => patch_overview
        7 => listener_overview
        8 => network_overview
        9 => os_overview
        10 => tfa_overview
        11 => summary_overview


See you tomorrow at the next post o this series!

Elisson Almeida


Monitoring database storage over-committing with OEM extention metric when using autoextend datafiles

Hi all,

Working on a project, I was asked to stop using autoextend on the database file, while setting up a new environment on a client, to avoid ASM diskgroup space issues.

In case the free space was not enough to handle all datafiles growth when often people would add datafiles in autoextend without checking the complete database e storage, which could cause a bigger problem.

I really like the autoextend, as it can prevent processes from failing and even more. Instead of be wasting space as often, in multiple tablespace environment, as the tablespace grows differently and as I mention not all validations are often done when adding space. We just want to resolve the issue and move to the next one.

So how can we save space by using it on where is needed and not being at risk of over-committing the storage use?

The idea is to monitor the database possible growth and compare with the current free space in the ASM diskgroup being used by the database.

So to accomplish that, I used column MAXBYTES in dba_data_files and dba_temp_files. In the example below we can see the current size from the BYTES column and the MAXBYTES as the limit to which the file can grow to be.  If the MAXBYTES is 0 the file does not have autoextend on.

SYS@db011>select TABLESPACE_NAME,FILE_NAME,BYTES,MAXBYTES from dba_data_files where TABLESPACE_NAME like 'SYS%' or TABLESPACE_NAME='UNDOTBS1';

TABLESPACE_NAME FILE_NAME BYTES MAXBYTES
------------------------------ -------------------------------------------------------------------------- ---------- ------------
SYSTEM +ORA_DATA/db01/datafile/system.264.1032015007 2147483648 32212254720
SYSAUX +ORA_DATA/db01/datafile/sysaux.319.1032015009 2751463424 32212254720
UNDOTBS1 +ORA_DATA/db01/datafile/undotbs1.320.103201500 4294967296 0

So, to gather the max database size, I summed the greatest value between BYTES and MAXBYTES (when available) and using the v$asm_diskgroup to grab the current avaliable space from the diskgroup used in the db_create_file_dest parameter and finally subtracting the available space from the max database size:

select dg.FREE_MB - round((dbf.max+tempf.max),0) as total_free
from
(select trunc(sum(greatest(maxbytes,bytes)/1024/1024)) as max
from dba_data_files ) dbf,
(select trunc(sum(greatest(maxbytes,bytes)/1024/1024)) as max
from dba_temp_files) tempf,
(select FREE_MB
from v$asm_diskgroup where name in (select LTRIM( value, '+' ) from v$parameter where name='db_create_file_dest')) dg;

Based on this we can create several ways to avoid the storage over-committing.

The one I used was to create a metric extension:

If the value of the above query is negative, means that the max database size is greater than the available size therefore the capacity plan for that database must be reviewed.

  1. To create the metric extension, go to, on the OEM menu  – Enterprise -> Monitoring -> Metric Extension > Actions -> Create -> Metric Extension.
  2. In the General Properties page select the target type as Cluster database if it´s RAC or Database instance.
  3. In the Adapter, select “SQL”
  4. In Collection schedule, enable the metric, upload the data and set the collection frequently to your environment needs.
  5. In the Adapter page add the above query.
  6. In the Columns page, add a column for the result of the query.
    1. To fit my environment I only set the critical alert and in case the value of the metric is below 0.
  7. Continue filling the necessary information on the next pages, as well as test the new metric on a selected target, Afterwards save the new metric.
  8. Prior to deploying it to any target you need save the metric as a deployable draft, select the created metric and go the action menu and select Save as Deployable draft

Now you can deploy the new metric to the targets.

Hope this can help!

Elisson Almeida

Oracle Patching with OPlan

Everyone that I’ve worked with knows that I don’t like patching (and sometimes I try to imagine who does), but they are necessary to corrects bugs and improve the Oracle software stability.

When you have a single node server with one database, the patch planing is no brainer but when you have a RAC with multiple nodes, different Oracle homes and so on, the planning and preparations start to get more complex and it is easy to miss or overlook a step in the planning which can lead to issues during your patching.

So to help me with all that I use oplan. Oplan is a tool which comes with along OPatch and you can get its latest version in patch 6880880

More informations on oplan can be found here: Oracle Software Patching with OPLAN (Doc ID 1306814.1)

OK, so what do I used it most for?

Generating the apply patching steps, which are very in handy:

$ORACLE_HOME/OPatch/oplan/oplan generateApplySteps <bundle patch location>

And my favorite, rollback steps, which I have done more times that I would like to admit:

$ORACLE_HOME/OPatch/oplan/oplan generateRollbackSteps <bundle patch location>

Also as rollback, I do tar of the oracle binaries being patched prior as there times even the rollback did not work :-/

Both files will be created under the directory below and you will see an html and text files.

$ORACLE_HOME/cfgtoollogs/oplan/<TimeStamp>/

This process is to help you organise your steps, read it through prior executing to make sure it makes sense in your environment

Oplan has its limitations, from the Oracle note which I mentioned above:

Data Guard configurations are not supported.
OPlan can be used to create patch plans for Oracle home's running Oracle Data Guard configurations, but OPlan does not consider such an environment usable as 'Data Guard Standby-First Patch Apply' alternative. See the following for additional information on 'Data Guard Standby-First Patch Apply'

<Document 1265700.1> Oracle Patch Assurance - Data Guard Standby-First Patch Apply

Shared Oracle Home Configurations are not supported.

Single Instance Databases running in the same configuration are not supported

Even so I would still use it as it generates a plan based on your target environment adding more information that you would need to do manually if you were only to read the README files from the patching

Hope it helps.

Thanks and until next time

Elisson Almeida